Visualizing data with t-SNE
I’ve just watched this Google tech talk by one of the proponents of the t-SNE visualization technique.
The idea is to perform a mapping that preserves local similarities after the embedding. The objective is fundamentally different from that of PCA.
It allows learning of non linear structures in data, as opposed to PCA. So it can find the bold line bellow (while PCA finds the dashed one): 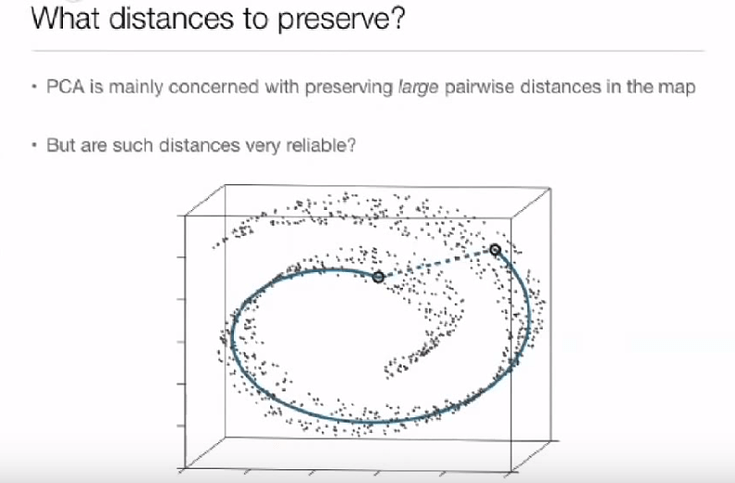
Article on distill about using t-SNE effectively: https://distill.pub/2016/misread-tsne/
Article on multiple optimization-based visualization techniques, including demo on MNIST: http://colah.github.io/posts/2014-10-Visualizing-MNIST/
Disclaimer: originally posted internally at Mnemosyne’s Openlab