Visualizing and interpreting neural networks
I’ve been interested in methods to visualize what is going on inside a neural network — mainly CNNs but not restricted to them.
I’ll start with this informative article on Distill reviewing different ways of producing feature visualizations for deep CNNs.
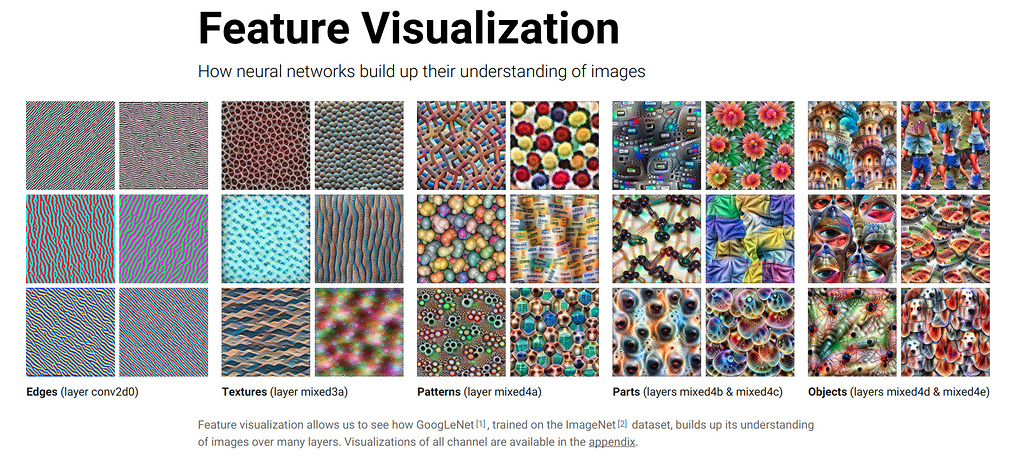
The general idea of all these methods is to pick a network unit (or channel, or layer), and optimize an initially random input image to maximize its activation.
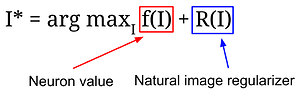
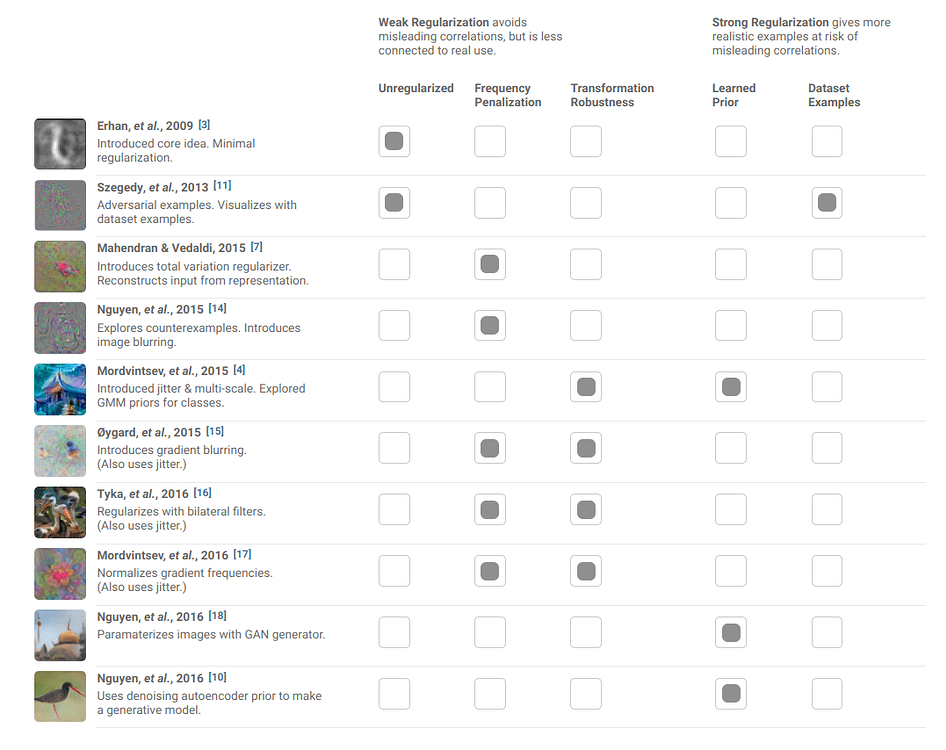
A very important part of this process is imposing some regualizarion prior, to enforce more “natural looking images. The choice of the regularizations heavily influences the quality of the images produced, as the article sumarizes in this table:
The same idea is used to create saliency maps for networks — find to which parts of an image a neuron most responds. One can also start with seed images and get to image style transfer and deepdream compositions (see stanford slides for examples.
UPDATE: 22/03/2018
With a new article on distill, The building blocks of interpretability, Google has released a library for feature visualization called Lucid: https://github.com/tensorflow/lucid It should be possible to produce visualizations for any network you can charge in tensorflow, using the module optviz. However this processes has its own hyperparameters that have to be tuned to obtain visually meaningful representations. I haven’t tried this library yet, but I have tried a keras one before with MNIST+Omniglot, could’not get anything meaningful. I’d say it demands some time investment.
Disclaimer: originally posted internally at Mnemosyne’s Openlab